

For many offline stores, it’s hard to see what really happens between a customer entering the store and checking out. Traditional metrics like total sales provide a final score but fail to explain the journey.
This is where store layout heatmap analysis becomes an essential tool for modern commerce. Transforming in-store movement into data helps retailers identify popular areas, rushed zones, and aisles that get little attention.
Data-driven store design replaces guesswork and allows managers to optimize their retail space like a well-designed website. Visualizing these patterns reveals the invisible forces that drive or deter a purchase.
Successful implementation of these strategies turns passive observation into a powerful engine for sales optimization. This guide explores how to master these analytical techniques to transform your retail environment into a high-conversion space.
1. Profitable Benefits of Store Layout Heatmap Analysis
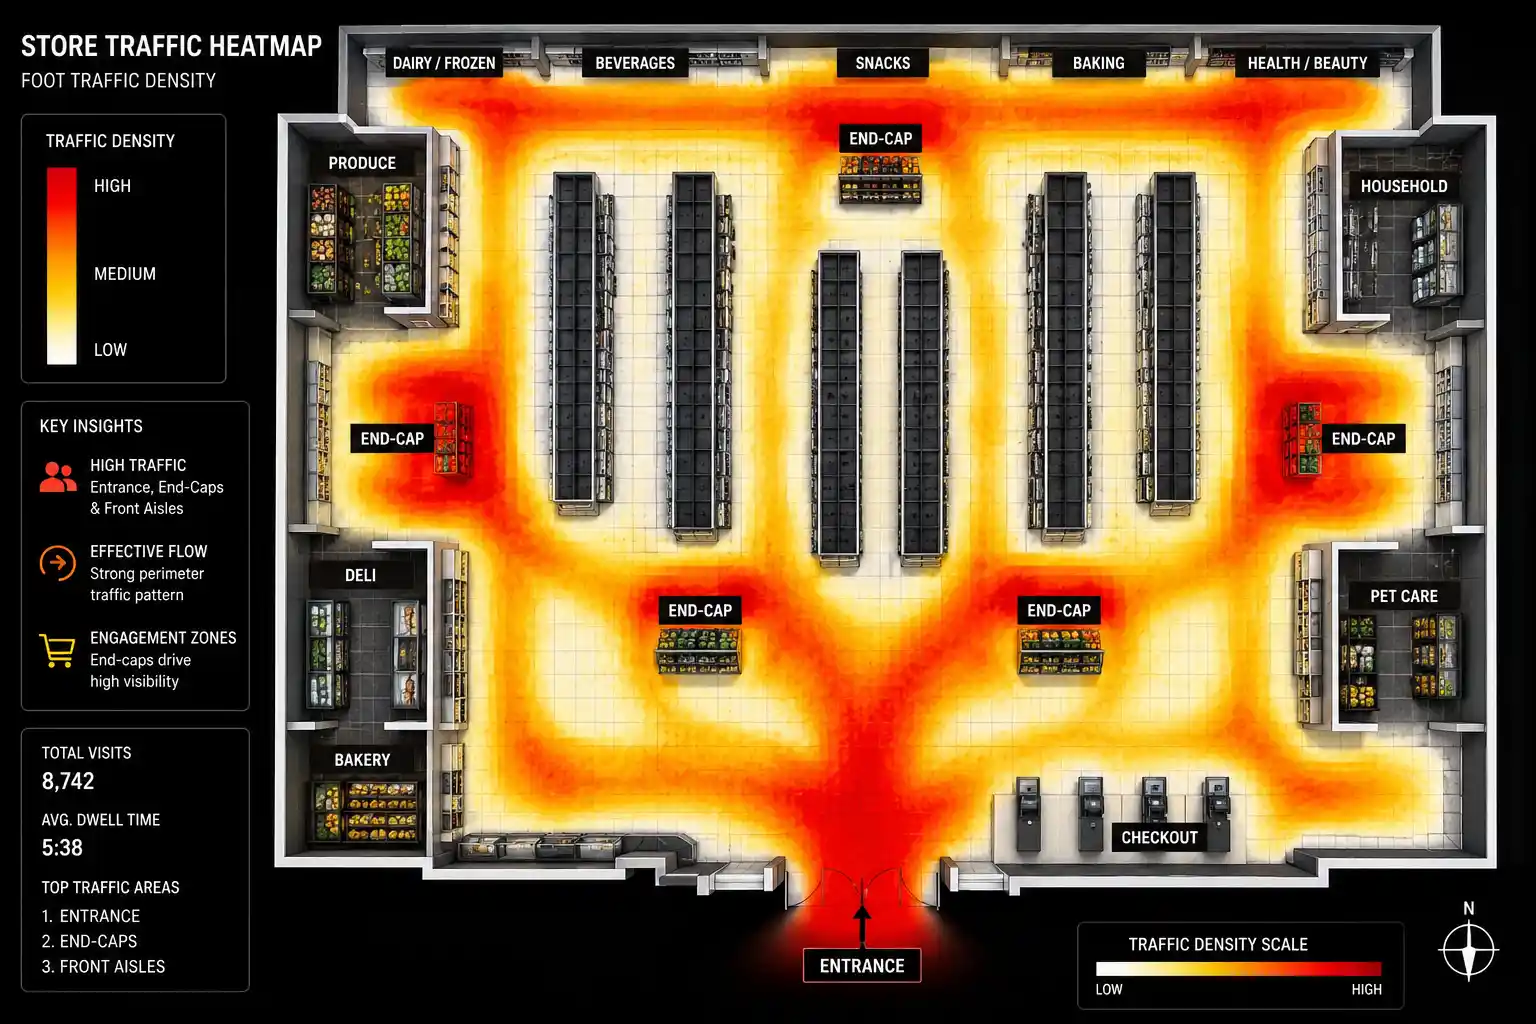
Store layout heatmap analysis turns abstract customer movement patterns into clear visual evidence. Instead of relying on staff anecdotes, managers see a color-coded map of actual density.
Red zones indicate high activity, while blue zones highlight neglected areas that may require a change in strategy. This clarity empowers decision-makers to justify expensive floor changes with cold, hard data.
Visualizing the exact movement of every shopper allows for a granular understanding of the “decompression zone” at the entrance. Most shoppers need a moment to adjust to the store environment before they begin looking at products.
Heatmaps identify where this adjustment ends and where real engagement begins. This strategy helps teams focus visual merchandising on areas where people actually engage, rather than just pass by.
Store layout heatmap analysis helps locate the most valuable engagement zones for high-margin products. Placing a high-margin product in a “cold” zone naturally reduces sales, regardless of the product’s quality.
When retailers reposition products to high-traffic POS areas based on heatmap data, conversion rates often improve immediately.
Store layout heatmap analysis proves the value of seasonal displays with hard traffic data. Retailers spend thousands on temporary installations for holidays or special events.
Heatmaps help measure whether customers stop at these displays or avoid them altogether. This level of customer behavior tracking ensures that every square foot of the store contributes to the bottom line.
Store layout heatmap analysis reduces friction in the path to purchase by identifying bottlenecks. If a heatmap shows a cluster of activity in a narrow aisle, it likely indicates a bottleneck.
These physical frustrations often lead to “basket abandonment” in physical stores. Improving wayfinding with movement data helps customers navigate faster, feel more comfortable, and buy more.
2. Modern Tools for Capturing Precise Shopper Data
Capturing high-quality data requires the right infrastructure. Many retailers start by converting existing security cameras into AI-powered sensors.
Advanced computer vision software can process standard video feeds to track customer movement patterns without requiring new hardware. This is often the most cost-effective entry point for businesses looking to begin traffic flow analysis.
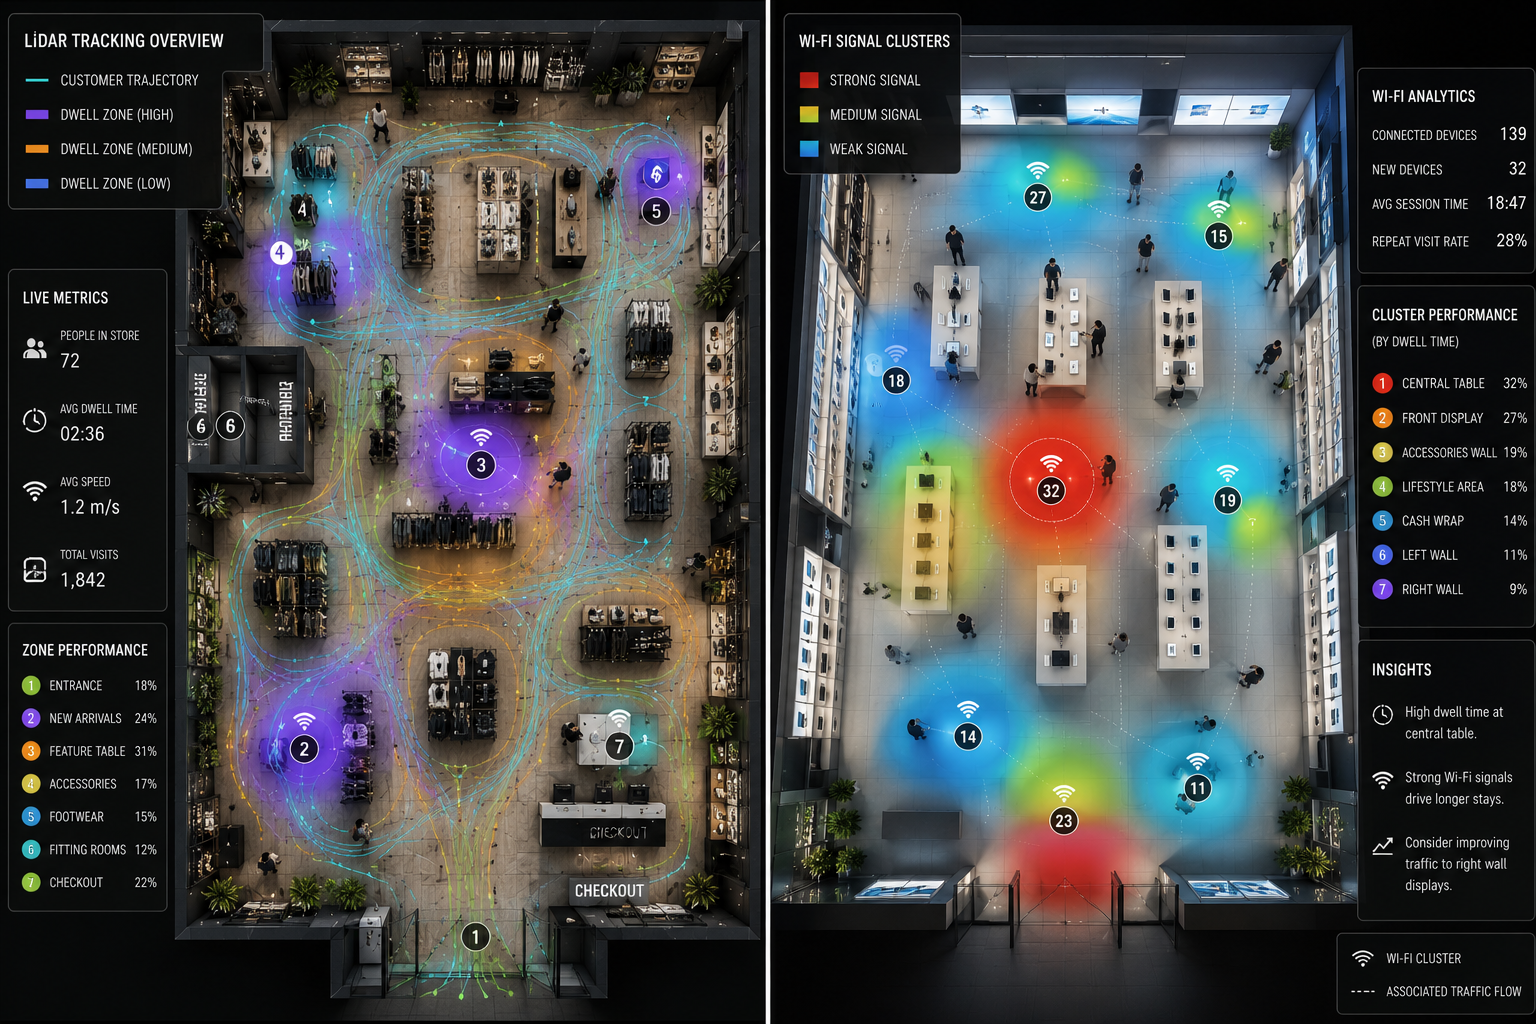
For more advanced needs, LiDAR (Light Detection and Ranging) offers anonymous 3D tracking. LiDAR sensors emit laser pulses to map the environment and the people within it.
This technology supports space analysis by operating reliably under various lighting conditions and providing accurate distance information. Crucially, LiDAR does not capture facial features, making it a favorite for privacy-conscious brands.
Businesses can use Wi-Fi signal patterns to track loyalty and recurring visits. When a customer’s smartphone searches for a network, it emits a unique identifier.
By mapping where these signals aggregate, retailers can understand how “power shoppers” move differently compared to first-time visitors. This data is invaluable for long-term store layout planning and loyalty program integration.
Store layout heatmap analysis can be cross-referenced with demographic data from Bluetooth beacons. While heatmaps typically show where people are, Bluetooth can help identify who they are if they have the store’s app installed.
This allows for a deeper layer of insight into how different age groups or segments navigate the floor.
3. Standard Workflow for a Successful Layout Audit
Store layout heatmap analysis requires a clear baseline of at least two to four weeks of data before making any changes. This period should include both weekdays and weekends to account for varying customer behavior tracking patterns.
Without this baseline, it is impossible to measure the effectiveness of future interventions.
Store layout heatmap analysis identifies primary highways and dead zones across the floor. Highways are the paths the vast majority of shoppers take, often leading from the entrance to the back of the store or the restrooms.
Dead zones are the corners and alcoves that see almost no foot traffic. By analyzing traffic flow, managers can see if dead zones result from lighting issues, bad signs, or obstacles in the store.
Store layout heatmap analysis measures dwell time at high-margin shelves to reveal true interest. It is not enough to know that people walk past a shelf; you must know if they stop.
“Dwell time” is a key indicator of interest. If people are stopping but not buying, the issue is likely the product or the price. If they aren’t stopping at all, the issue is the retail store design or the visibility of the display.
Store layout heatmap analysis matches movement data with POS results to find conversion per square foot. Looking at both traffic heatmaps and sales reports makes it easy to spot profitable areas and crowded zones with low sales.
This holistic view is the cornerstone of sales optimization.
4. Proven Techniques to Redesign the Retail Floor
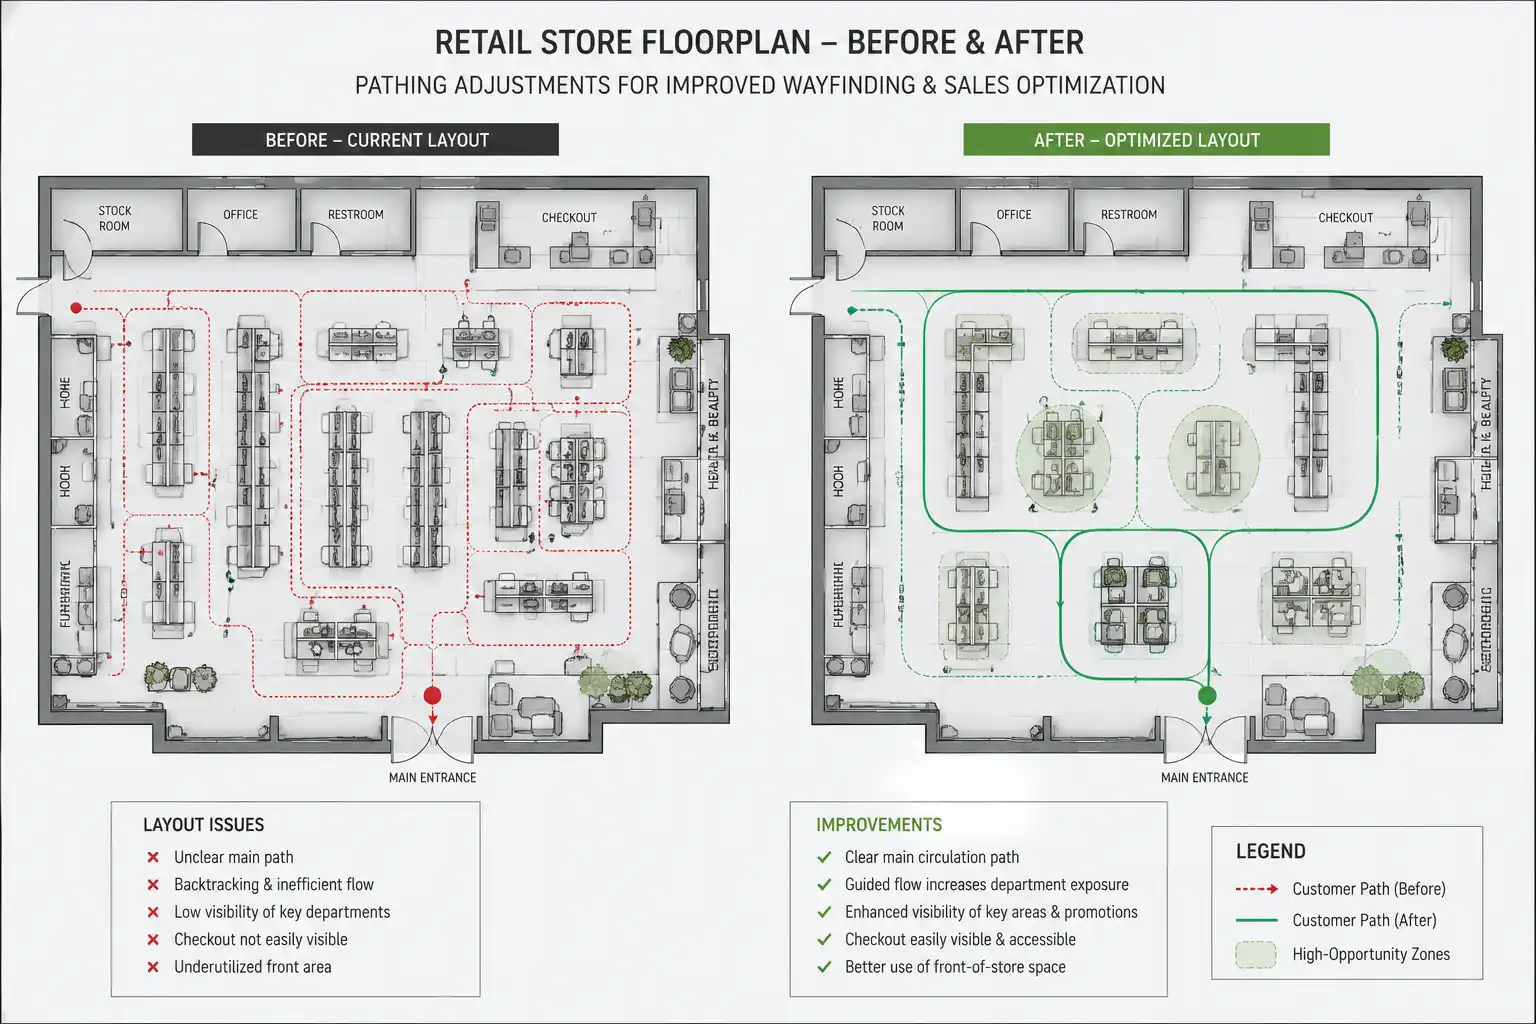
Once the data is collected, the focus shifts to physical store layout planning. The priority should be eliminating bottlenecks that kill conversion rates.
When many people bunch up near the entrance or a display on the heatmap, it indicates that the aisle width may be insufficient. Increasing aisle width helps prevent crowding, making shoppers more comfortable and more likely to stay at the display.
Placing top sellers in high-density hotspots is a classic strategy, but heatmaps allow for surgical precision. Instead of guessing which end-cap is most visible, you can place your highest-margin items exactly where the most eyes land.
This visual merchandising tactic ensures that your best inventory gets the most “organic” impressions from passersby.
To increase traffic in low-visibility areas, retailers often place essential products in the back corners of the store. This encourages customers to walk through more of the space. Heatmaps can track if this move successfully pulls traffic through the rest of the store.
This approach helps use store space better by making customers walk past more impulse items before reaching what they need.
Store layout heatmaps help guide staff scheduling by assigning employees to high-traffic zones for timely customer support. A consistent fitting room hotspot at 2:00 PM on Saturdays, combined with low sales, suggests delays in staff support rather than strong buying intent.
5. Essential Rules for Ethical Consumer Tracking
Data collection must always be balanced with privacy. Encrypting data to ensure total privacy is a non-negotiable standard.
Store layout heatmap analysis requires automatic face blurring to protect personal privacy. Good customer behavior tracking software turns people into anonymous dots or skeletons before saving the data, protecting customer privacy. This ensures that no personally identifiable information (PII) is ever at risk of being leaked.
To operate safely, retailers need to comply with global privacy regulations such as GDPR (Europe) and CCPA (California). Even if a shop operates solely in the United States, applying these strict guidelines helps show customers their data is taken seriously.
Clear explanations about how traffic data helps improve the store make customers feel more at ease and supported.
Finally, managing data security for cloud analytics is a critical technical requirement. When movement data is sent to the cloud for processing, it must travel through secure, encrypted tunnels.
Retailers should vet their technology partners to ensure they follow industry-standard security protocols. While space utilization data isn’t as sensitive as payment details, a security breach can still raise concerns about a brand’s ethics.
6. Expert Questions regarding Heatmap Implementation
What is a retail interaction heatmap?
A retail interaction heatmap visually maps customer movement and behavior throughout a physical retail space. Color gradients — usually blue for low traffic and red for high traffic — are used to highlight walking paths, stopping points, and product interactions.
By highlighting high-traffic and low-traffic zones, this tool allows managers to assess how effective their store design really is.
Is this technology affordable for small shops?
Yes, heatmapping technology has become significantly more accessible. Instead of costly custom LiDAR installations used by large retailers, small store owners can adopt SaaS solutions that integrate with their existing cameras.
Many of these services use monthly plans that cost about the same as a regular internet bill, making data-driven sales optimization affordable for small and local stores.
Which retail sectors see the fastest ROI?
Grocery stores, fashion retailers, and big-box electronics stores typically see the fastest return on investment. These sectors rely heavily on impulse buys and high-volume traffic.
Here, even minor improvements—such as a 2–3% increase in space efficiency or better wayfinding—can add thousands in monthly revenue, investing in analytics pay for itself fast.
Is video tracking better than infrared sensors?
Both have advantages. Video tracking using computer vision gives more detail, such as whether a shopper is looking at items on a high shelf or a low shelf.
However, infrared sensors and LiDAR are superior for maintaining 100% anonymity and working in low-light conditions. Most experts recommend video tracking for visual merchandising analysis and LiDAR for general traffic flow analysis, where privacy and high-level movement are the primary concerns.
Mastering store layout heatmap analysis provides a competitive edge that traditional retailers simply cannot match. By treating the physical store as a dynamic environment that can be tested and tuned, business owners stop guessing and start growing.
For more information on the latest in retail technology, visit the National Retail Federation website. The future of retail belongs to those who understand their customers’ every step, ensuring that every trip to the store is efficient, engaging, and ultimately, profitable.
In a landscape where every advantage counts, store layout heatmap analysis is the ultimate map to success.


15 Proven Methods on How to Consolidate Event Data Efficiently to Maximize Analytics ROI
6 Critical Strategies for Mastering IoT Foot Traffic Sensors: The Ultimate 2026 Accuracy Guide
12 Powerful Ways to Quantify Total Booth Performance After Every Event
7 Best Offline Foot Traffic Sensor Technologies to Maximize Retail Performance
7 High-Impact Strategies to Scale Revenue with Lead Capture Automation
AI Heatmap Analysis for Retail Stores: 5 Data-Driven Strategies to Maximize Revenue