

Have you ever walked away from a major trade show feeling worn out, yet unsure if the event truly delivered any real value? As we pack up the booth, the same question always comes up: Will all those conversations and handshakes really pay off?
Real insight into your booth performance comes from data — not just instincts — gathered throughout the exhibition.
In this guide, we will walk through the exact metrics and strategies we use to evaluate every aspect of a show. These twelve methods give you a complete view of your event ROI — from how many leads you generate to how well your staff performs.
We want to ensure that every dollar you spend on visual appeal and interactive displays translates into measurable growth.
By the time you finish reading, you will have a clear framework for your next post-show debrief. Let’s dive into the quantitative and qualitative indicators that define modern exhibition success in a competitive marketplace.
1. Essential Booth Performance Metrics for Quantitative Lead Tracking
The foundation of any post-event analysis starts with the raw numbers. We need to know exactly how many people entered our orbit and what it cost us to get them there. With this quantitative data, we can compare different shows on the same basis, regardless of where they are held or which industry they belong to.
Analyzing Acquisition Volume and Financial Efficiency
First, we look at Total Lead Capture vs. Pre-Show Targets. Before the doors even open, we always set a specific goal for the number of contacts we want to collect.
Missing a 500-lead target and landing at 300 means something went wrong—either the marketing didn’t resonate, or traffic flow inside the venue worked against you.
Next, we calculate the Comprehensive Cost Per Lead (CPL). To calculate this, start by adding up your total event investment, including logistics, booth rental, and travel costs. Then, divide that number by the total leads you collected.
This number is vital because it helps us justify the budget for future years. A higher CPL compared to digital marketing means it’s time to rethink how we engage booth visitors.
Evaluating Physical Traffic and Engagement Depth
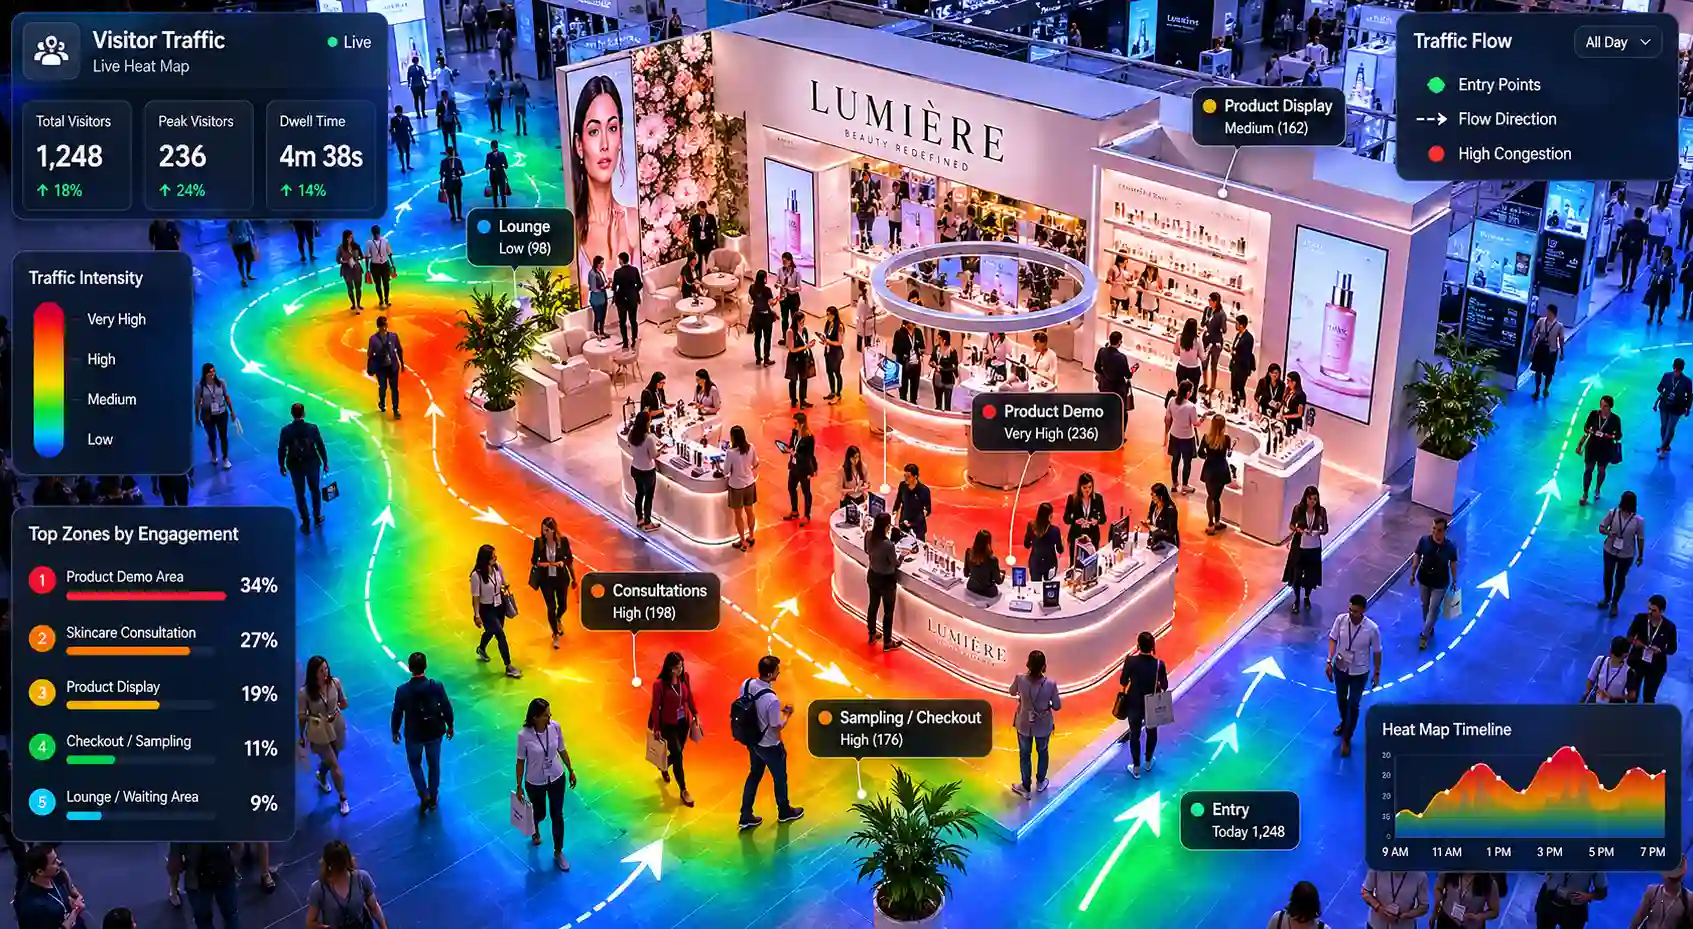
We also measure Booth Attraction Efficiency vs. Hall Footfall. Most show organizers provide general attendance numbers after the event. Comparing passersby to stop-ins helps us measure how eye-catching the booth is and how well products are showcased.
Finally, we analyze Visitor Dwell Time and Demonstration Participation. Handing out a pen is easy; holding someone’s attention for ten minutes is what really matters. Heat mapping and badge scanning show us which interactive displays really kept visitors engaged.
2. Measuring Qualitative Success and Professional Staff Performance
Numbers tell part of the story, but the quality of your interactions defines the long-term value of the event. We cannot rely on volume alone if the leads are not a good fit for our business.
This level of booth measurement focuses on brand representation and audience perception, not just foot traffic.
Grading Lead Intent and Asset Popularity
We implement a system for Targeted Lead Quality Scoring and Grading. Not all leads are created equal. We train our team to categorize prospects as “hot,” “warm,” or “cold” based on their immediate needs and budget.
This allows our sales team to prioritize follow-ups according to lead generation potential rather than just chronological order.
| Lead Grade | Criteria | Follow-up Action |
| A (Hot) | Immediate need, budget confirmed | Call within 24 hours |
| B (Warm) | Interest shown, 3-6 month window | Email sequence & personal note |
| C (Cold) | General info, no specific project | Add to monthly newsletter |
We also track Strategic Content Engagement and Download Rates. If we offered a digital white paper via a QR code, how many people actually scanned it? This metric tells us if our presentation skills and customer experience were compelling enough to drive a secondary action.
Assessing Team Productivity and Brand Representation
To measure Individual Staff Scanning and Interaction Performance, we look at the data from each team member’s scanner. This is not about micromanagement; it is about identifying who excels at visitor engagement. It helps us determine where more staff training might be needed for future exhibitions.
Lastly, we gather Subjective Brand Sentiment and Qualitative Feedback. We ask our staff to record common questions or comments they heard from visitors. This feedback collection often reveals more about our brand visibility and market position than any spreadsheet ever could.
3. Proving Financial Value and Total Sales Pipeline Performance
The true test of exhibition success often happens months after the crates have returned to the warehouse. We must track how those initial conversations turn into real contracts. This requires a strong bridge between the marketing team and the sales department.
Mapping Revenue Potential and Deal Attribution
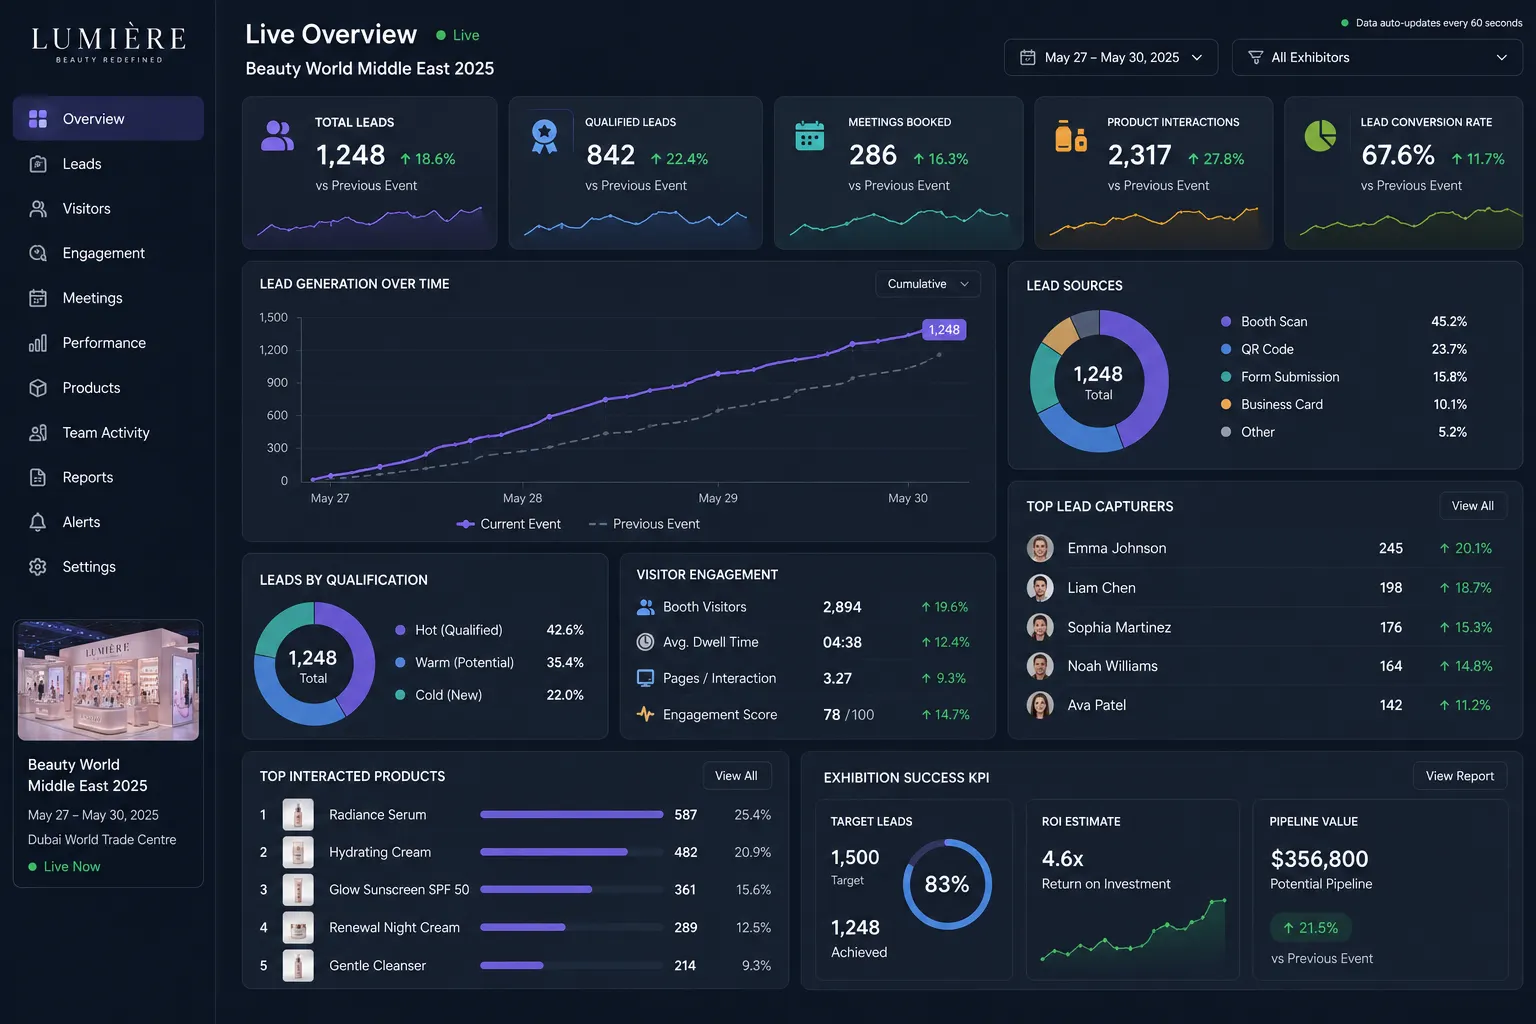
We calculate the Projected Sales Pipeline Value Generation shortly after the show. With booth performance data in hand, we can clearly communicate the event’s impact to leadership long before the sales numbers are finalized. By looking at the estimated deal size of our “Grade A” leads, we can forecast the potential return on investment.
We also perform an Integrated Customer Acquisition Cost (CAC) Analysis. We compare the cost of winning a customer at a trade show versus other channels. Trade shows cost more upfront, but face-to-face meetings often deliver faster closes and greater lifetime value.
Establishing Long-Term ROI Benchmarks
The most important metric is Closed-Won Revenue Attribution Tracking. We use our CRM to tag every lead that originated from the event. When we follow leads from the booth all the way through the sales cycle, it becomes easy to connect booth performance to actual revenue.
We also conduct a Competitor Presence and Market Share Comparison. Did our competitors have a larger presence? Were their interactive displays busier than ours? Understanding our brand visibility relative to the competition helps us adjust our marketing strategies for the next cycle.
4. Conducting Operational Debriefs to Refine Future Booth Performance
Beyond the sales and leads, we must look at how the operation actually ran. We sit down with the entire team to discuss event logistics. Was the booth easy to assemble, or did we waste hours on technical glitches? We want to identify any friction points in the customer experience.
We also evaluate the visual appeal of our setup. Did the lighting work as intended? Was the product showcasing clear from the aisle? We often find that small changes in traffic flow management can lead to significantly better results at the next show.
During these meetings, we review the feedback collection from the floor. If visitors consistently asked for a feature we don’t have, that information goes straight to our product team. We view every show as a massive, live-action focus group for our brand.
5. Supplemental Analysis for Resolving Measurement Hurdles
Measuring performance is not always straightforward, especially when dealing with technical glitches or human error. We have found that having a “plan B” for data collection is essential.
When digital scanners fail, having manual lead forms as a backup ensures every lead opportunity is still captured.
Common Questions Regarding Technical Booth Performance Analytics
Does a high lead count always indicate successful booth performance?
Not necessarily. We have seen shows where we gathered 1,000 leads, but only 5% were qualified. A smaller number of high-quality conversations that convert into sales will always outweigh thousands of badge scans from giveaway seekers.
What is the difference between passive attraction and active booth engagement?
Passive attraction occurs when someone stops to look at your visual appeal or interactive displays without talking to anyone. Active engagement involves a two-way conversation or a demo. We track both, but we weight active engagement much more heavily in our final report.
How should performance tracking vary by booth size and budget?
For smaller booths, we focus more on presentation skills and 1-on-1 visitor engagement. With large island booths, performance is measured by how smoothly traffic flows and how technology moves visitors through each part of the brand journey.
How does physical booth performance ROI compare to digital marketing channels?
Digital channels often have a lower CPL, but physical events usually offer a higher conversion rate. According to industry insights from Exhibitor Online, face-to-face marketing significantly shortens the sales cycle by building trust more quickly than an email ever could.
6. Closing the Performance Loop Through Risk Management and Mitigation
Finally, we look at what didn’t go as planned. Every event has risks, from shipping delays to staff training gaps.
We document these hurdles so we can mitigate them in the future. If a specific technology integration fails, we decide whether to fix it or replace it with a more reliable one.
Our booth performance framework turns every show into a learning opportunity. When we use these twelve metrics consistently, we stop guessing and start knowing exactly how to engage our audience effectively.
To maximize your future booth performance, you must stay committed to the data even when the show floor gets hectic. We hope this framework helps you prove the incredible value of your events and secures the budget you need for your next big win.
Remember, the best time to start measuring is the moment the first visitor walks through the door.


6 Breakthrough Strategies to Master Store Layout Heatmap Analysis and Skyrocket Sales
10 Professional Secrets to Own a Strong Lead Database After Events Without Failure
7 High-Impact Strategies to Scale Revenue with Lead Capture Automation
11 Strategic Remote Store Performance Analytics Tactics to Revolutionize Retail Growth
10 Essential Variables for a Reliable KPI for Beauty Booth Evaluation
17 Proven Tactics to Dramatically Improve Your Booth Strategy for Next Events